

EMI – Water management software
EMI: The benchmark in water management software
With EMI, take control of your water resources, protect your infrastructure and anticipate water-related challenges. And be supported by experts in hydrogeology.
Monitor, anticipate and optimise your water resources
EMI: The high-performance application for keeping control of your water resources and ensuring the performance of your boreholes.
Software designed for water management professionals
The tool that saves you time, money and makes the right decisions
Expertise in the field
Constantly evolving functionalities
New modules designed on request
Our team develops new modules to meet user needs. The latest: the prediction module with AI
A team of hydrogeologists at your service
EMI combines digital intelligence and human expertise to provide tailor-made support for each customer.
Adopt proactive and serene water management with EMI
Your boreholes
Optimise the performance and maintenance of your boreholes
- Complete identity files: history, regulations, performance
- Visualization of extraction capacity
- Continuous monitoring for optimum operation.
- Detection of malfunctions, warning of problems
- Anticipation of failures for proactive maintenance.
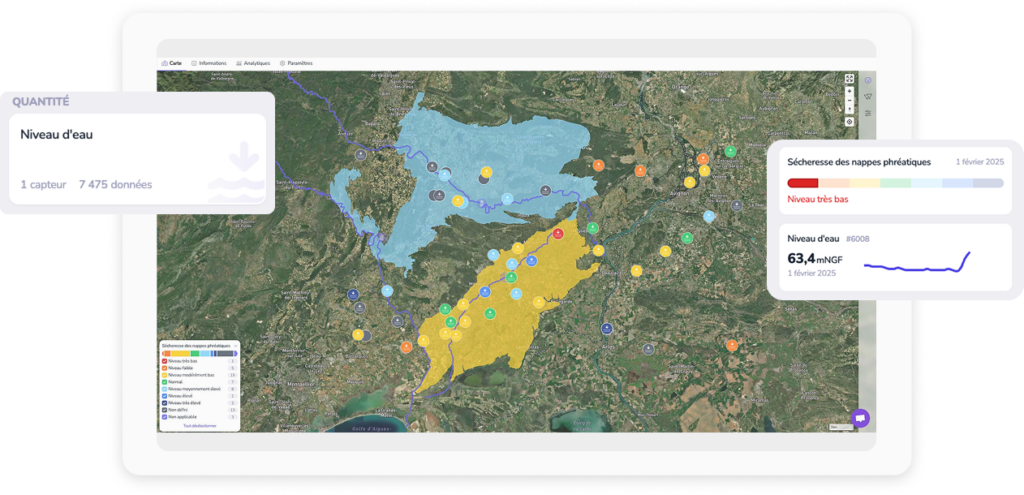
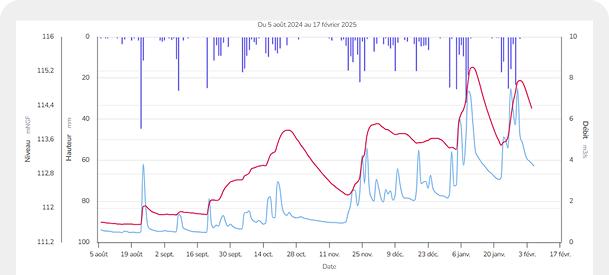
Monitor your water resources in real time
- Instant visualization of reserve levels and trends.
- Access to public and private data on water resources
- Access to current drought orders
Graphical display
Get your data graphically to make better decisions
- Centralize all your data in a single application.
- Customized mapping of your territory.
- Generate customized maps and graphs.
- Unlimited data cross-referencing for precise analysis and fine-tuning of your operating strategies.
And the support of our hydrogeologists
Action plan
Benefit from an action plan to secure the resource
- Action plan integrated into EMI for easy monitoring of progress
- Plan drawn up by our hydrogeology specialists for efficient, sustainable management of your resources
Support
Be supported by our hydrogeology experts
- Multi-channel support: live chat, telephone
- Consulting and hydrogeological studies
- Rapid intervention in the event of technical or regulatory problems
- Annual review meeting: past and future actions and projected budget

And a host of other features that our users appreciate
- Data control
- Data export
Catchment management
- Notification in case of anomaly or critical drop
- Centralized document management (permits, reports, etc.)
Water resource management
- Access to meteorological and hydrogeological data
- Integrated regulatory indicators
Advanced graphical visualisation
- Powerful visualization and decision-support tool
- Customizable crosstabs for advanced analysis
User management and collaboration
- Advanced user rights management
- Access for external users
- Unlimited number of users
Assistance and support
- Live chat with our hydrogeologists
- Expert, personalized support
- Annual assessment by a hydrogeologist

Jean Luchier, hydrogeologist Product Owner of EMI software for local authorities
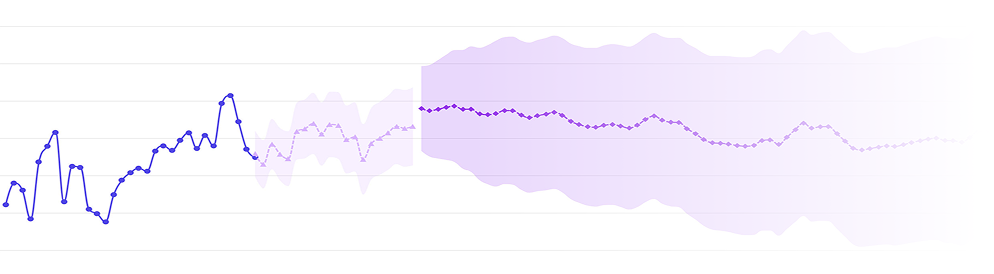
New
Prediction with the IA
The latest news from EMI
Find out about the latest features, webinars, discussions with our user communities…
Optimise the use of water resources now!
Frequently Asked Questions
EMI application
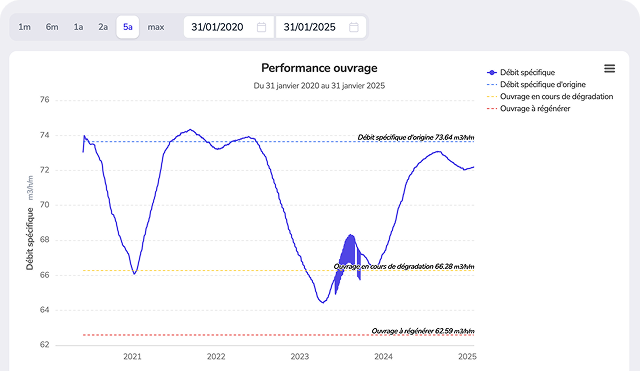
Absolutely. EMI performs an algorithmic calculation to determine the specific flow rate, a performance indicator that we use to establish several thresholds:
- Current specific flow
- Original specific flow
- Work in progress
- Work to be regenerated.
This means you receive an immediate alert when a borehole shows signs of deterioration.
The application allows you to monitor the performance of the borehole and its state of health in real time, and enables you to take regeneration measures before the borehole is irreparably compromised.
Yes, this advance has been made possible by artificial intelligence, in particular mathematical models based on Machine Learning and Prophet. We can predict groundwater levels and river flows 20 days in advance, and assess future seasonal trends based on the same data 90 days ahead.
For the moment, this feature is only available for piezometers, but we are working on extending it to boreholes.
What’s more, AI allows you to generate a summary of the state of drought in your area, giving you an overall view of the situation.
When we initialise EMI on behalf of our customers, we ask them to provide us with all the information and documents required for each of their works. We then sort and import the relevant data into the application to make it complete and operational.
There are two possible scenarios:
- Customers can download new items themselves over time, directly into the application.
- imaGeau regularly follows up with the customer and receives items on their behalf, which we upload to the application as we go along. The customer can also add documents as required.
Yes, EMI makes it easy to share information, with the option of exporting the graphic as an image (SVG, JPEG or PNG), as data (CSV or XLS), or as a PDF.
The EMI application enables local authorities using the same water table to share their data. This pooling of information and observations is an effective way of anticipating potential crises.
The EMI application considerably simplifies the process of securely sharing your data with the prefecture, which is responsible for monitoring and establishing water restrictions. No more time spent filling in Excel files every week: we offer you a simple solution to meet your data transmission obligations as a drinking water operator.
We’ve designed this feature to be easy to use, ergonomic and, above all, fully customisable. So you can change their appearance: colours, shape, display, layout, etc.
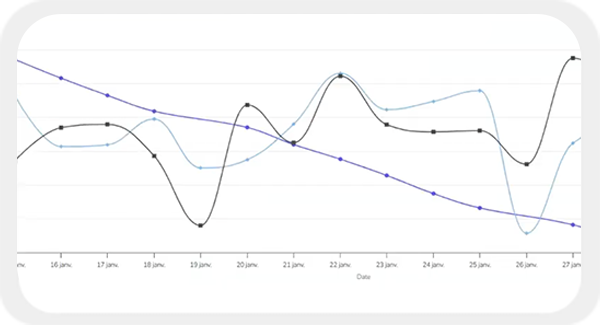
By default, you can view the data for your facility in the form of graphs to get an overall, visual perspective of the variable. But you also have the freedom to create your own customised graphs, by cross-referencing information from any private or public facility in your area. For example, you can compare the performance of a piezometer with rainfall data.
Once created, these graphics can be easily exported and shared.
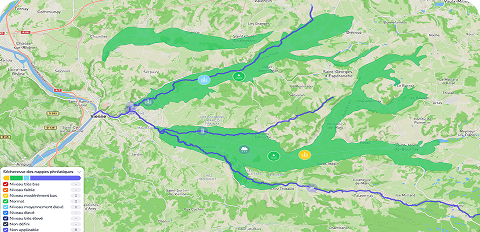
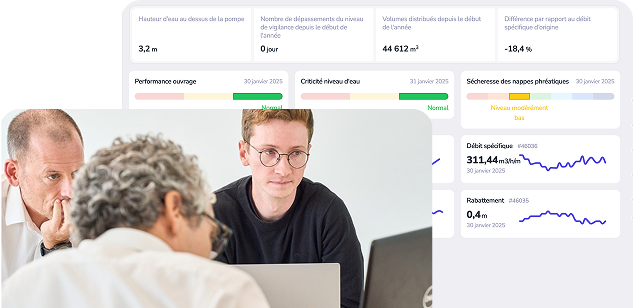
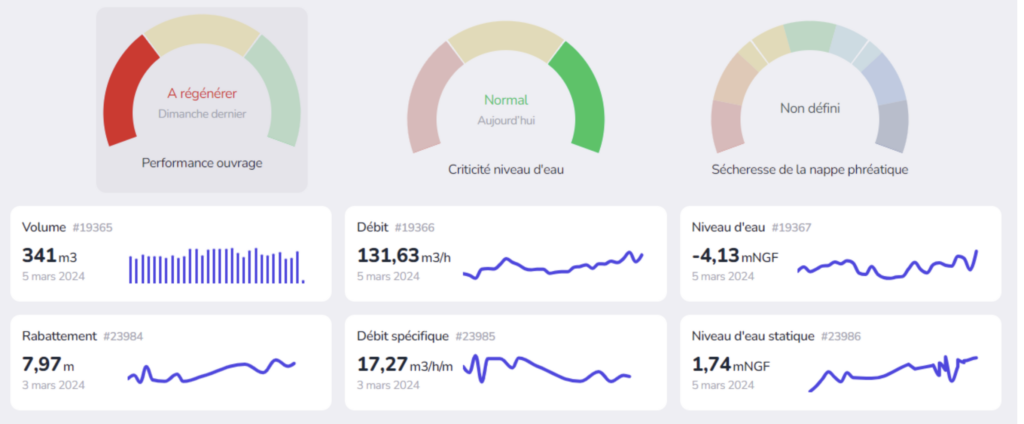
On your overview, you can get a direct view of the performance status of your borehole in relation to its colour:
- Green: normal
- Yellow: moderately low level
- Red: very low level
Clicking on the facility you are interested in takes you to the dashboard, which displays real-time data for your facility: facility performance level, volume, flow rate, water level, static water level, drawdown and specific flow rate.
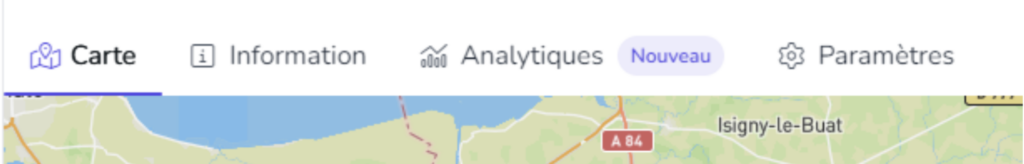
You will also find 5 other tabs:
- Information: static information about the borehole (BSS code, creation date, diameter, altitude of well screens, GPS coordinates, depths, which body of water it pumps into, administrative authorisations, etc.).
- Analytical: data in the form of dynamic graphs, with weekly and two-year views.
- Instrumentation : volume, flow rate, water level, static water level, drawdown, specific flow, metrics taken from sensors in the field, but which can also be integrated manually if required.
- Documents : an area where you can import files, reports, technical sections, diagrams, etc. – anything of interest relating to this station.
Settings: to modify or add information about the work.
The EMI application allows you to be alerted in the event of a prefectoral drought decree in your area. You can also view the content of the decree: communes concerned, period of validity, restrictions, history.
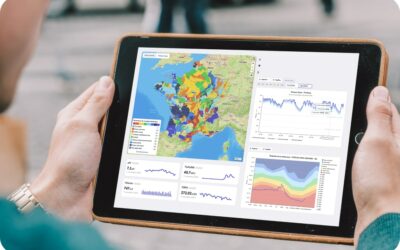
There’s also our infosecheresse.fr website, which provides live information on the state of drought resources in France, thanks to government open data databases on meteorology, hydrology and hydrogeology.
EMI data is updated according to the recording frequency, usually every 15 minutes. Although the application displays a daily average value, it is possible to display the precise data every 15 minutes. So you can choose to receive updates every 15 minutes or once a day.
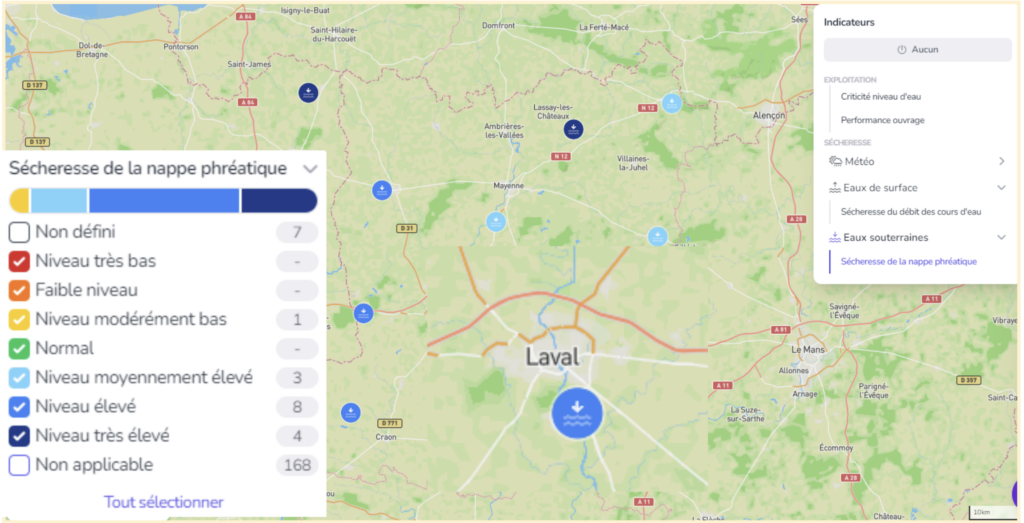
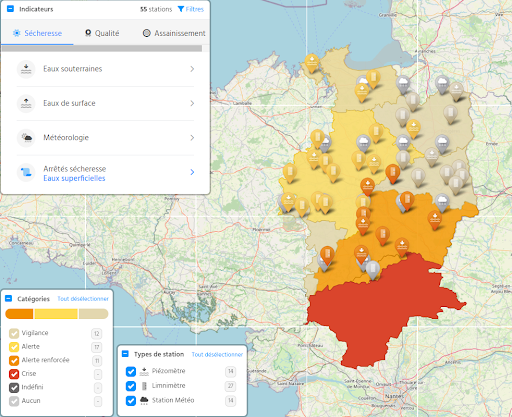
The application allows you to monitor data from your private network as well as from public stations:
- Boreholes/wells
- Sources
- Piezometers
- Limnimeters
- Watercourses
- Weather station
At a glance, you can see the state of the region’s resources thanks to various drought status indicators: normal, moderately low, low or very low. You can then click on one of the structures in particular to see in more detail the reason for the state observed.
EMI is aimed at all water managers who want to have an overall view of the state of water resources in their area, by bringing together all the data at their disposal in a single application.
Our users include :
- Resource managers within local authorities, who monitor the state of resources and ensure that there is enough water to distribute to the population.
- Employees of an EPTB (Etablissement Public Territorial de Bassin), whose mission is to monitor the state of water resources.
- Managers of industrial plants, who check the performance of their boreholes and the availability of water for their operating needs.